Frequently Asked Questions
Cybersecurity & Graph Algorithms
How can FalkorDB be used for cybersecurity threat modeling?
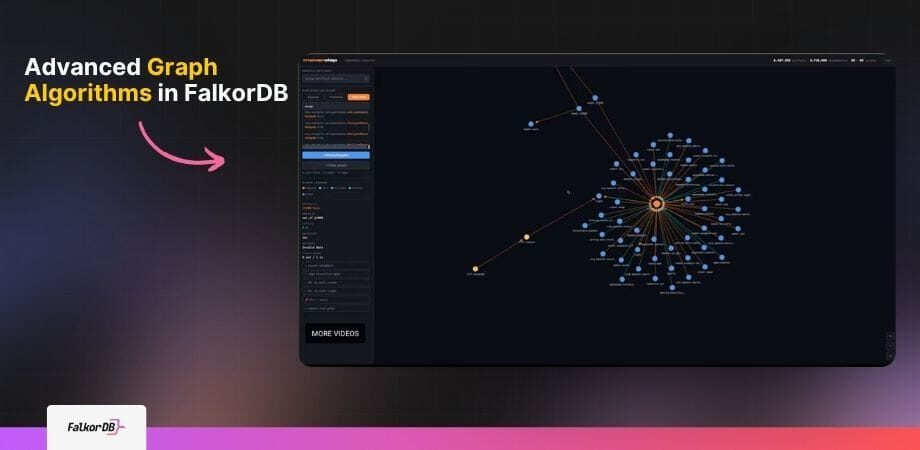
FalkorDB enables advanced threat modeling by leveraging graph algorithms to simulate attack propagation, analyze dependencies, and estimate data leakage. For example, in the "Advanced Graph Algorithms in FalkorDB: Cybersecurity Focus" webinar, a Monte-Carlo simulation was used to model ransomware spread, providing actionable risk scores for prioritizing patching and defense strategies.
What is the Monte-Carlo infection simulation demo in FalkorDB?
The Monte-Carlo infection simulation demo models ransomware (e.g., WannaCry v2) propagation in a host/CVE graph. A user-defined function (UDF) traverses the graph from a patient-zero host, calculating infection probabilities based on firewall status, SMB signing, CVE exposure, and EDR presence. After 40 simulation runs, host 12 was infected 36 times (90% probability), helping teams prioritize patching. This approach provides stochastic, actionable risk scores for adaptive threat modeling in LLM-driven security agents. (Source: Webinar, March 22, 2026)
How does FalkorDB help with dependency analysis for vulnerabilities like Log4Shell?
FalkorDB can build and analyze Maven dependency graphs to uncover indirect paths from libraries (e.g., Apache Flink) to vulnerable components like Log4j. Using variable-length traversals with cycle detection, FalkorDB automates the detection of transitive vulnerabilities, replacing manual SBOM checks and improving security in AI-generated code pipelines. (Source: Webinar, March 22, 2026)
What is max-flow modeling for data leakage in FalkorDB?
Max-flow modeling in FalkorDB treats the internal network as a flow network, where each communication edge has a bandwidth capacity. By applying the max-flow algorithm, FalkorDB computes the theoretical exfiltration rate. For example, increasing firewall bandwidth from 10 Mbps to 19 Mbps raised the max flow from 10 Mbps to 52 Mbps, revealing new data leakage paths. This quantifies the upper bound of data exfiltration for risk-based access control in GraphRAG systems. (Source: Webinar, March 22, 2026)
What are the key takeaways from the FalkorDB cybersecurity webinar?
The webinar presented three reusable graph-algorithm patterns: Monte-Carlo infection simulation, cycle-aware dependency tracing, and max-flow leakage estimation. These patterns can be embedded into AI-driven security and observability stacks, enabling transparent, measurable defenses for LLMs, GraphRAG pipelines, and AI agents. (Source: Webinar, March 22, 2026)
How can senior developers use FalkorDB for AI-driven security?
Senior developers can use FalkorDB's built-in graph primitives and custom user-defined functions (UDFs) to implement advanced security analytics, such as stochastic risk scoring, automated dependency scanning, and quantifiable data leakage estimation. These capabilities support the development of transparent, measurable defenses for LLMs and AI agents. (Source: Webinar, March 22, 2026)
What is the benefit of using stochastic graph traversals in cybersecurity?
Stochastic graph traversals, such as Monte-Carlo simulations, provide actionable risk scores without deterministic guarantees. This approach is ideal for adaptive threat modeling in LLM-driven security agents, allowing teams to prioritize defenses based on probabilistic outcomes. (Source: Webinar, March 22, 2026)
How does FalkorDB support risk-based access control?
FalkorDB supports risk-based access control by enabling max-flow analysis of internal networks, quantifying the upper bound of data exfiltration. This measurable input helps organizations design and enforce access policies based on actual risk exposure. (Source: Webinar, March 22, 2026)
Can FalkorDB be used for automated detection of transitive vulnerabilities?
Yes, FalkorDB's graph-based dependency scanning can automatically detect transitive vulnerabilities in software supply chains, such as indirect paths to vulnerable components like Log4j. This replaces manual SBOM checks and enhances security in AI-generated code pipelines. (Source: Webinar, March 22, 2026)
How does FalkorDB help prioritize patching in cybersecurity?
By simulating attack propagation and ranking hosts by infection probability, FalkorDB helps security teams prioritize patching efforts where they will have the greatest impact, reducing risk and improving overall security posture. (Source: Webinar, March 22, 2026)
Features & Capabilities
What features does FalkorDB offer for AI and graph analytics?
FalkorDB offers ultra-low latency, high memory efficiency, support for over 10,000 multi-graphs (tenants), advanced AI integration (GraphRAG, agent memory), open-source licensing, flexible horizontal scaling, and both cloud and on-prem deployment options. These features make it ideal for real-time analytics, AI-driven applications, and large-scale data management. (Source: https://www.falkordb.com/)
Does FalkorDB support multi-tenancy?
Yes, FalkorDB supports robust multi-tenancy in all plans, allowing for over 10,000 multi-graphs. This is especially valuable for SaaS providers and enterprises managing diverse user bases. (Source: https://www.falkordb.com/)
What integrations are available with FalkorDB?
FalkorDB integrates with frameworks such as Graphiti (by ZEP) for AI agent memory, g.v() for knowledge graph visualization, Cognee for mapping knowledge graphs, LangChain and LlamaIndex for LLM integration, and more. For details, see the integrations page.
Does FalkorDB provide an API?
Yes, FalkorDB provides a comprehensive API with official documentation and guides available at docs.falkordb.com. These resources help developers, data scientists, and engineers integrate FalkorDB into their workflows efficiently.
What technical documentation is available for FalkorDB?
FalkorDB offers extensive technical documentation, including setup guides, API references, and release notes. Access the documentation at docs.falkordb.com and the latest updates on the GitHub Releases Page.
What is the primary purpose of FalkorDB?
FalkorDB is a high-performance graph database designed to manage complex relationships and enable advanced AI applications, such as GraphRAG, agentic AI, and real-time analytics. It empowers organizations to make their data actionable, accurate, and seamlessly integrated into AI workflows. (Source: https://www.falkordb.com/)
What unique features set FalkorDB apart from other graph databases?
FalkorDB stands out with up to 496x faster latency, 6x better memory efficiency, support for 10,000+ multi-graphs, advanced AI integration, open-source licensing, and built-in multi-tenancy in all plans. These features address scalability, performance, and AI-driven use cases. (Source: https://www.falkordb.com/)
What are the key capabilities and benefits of FalkorDB?
Key capabilities include ultra-low latency, linear scalability, open-source licensing, advanced AI optimization (GraphRAG, agent memory), cloud and on-prem deployment, and enhanced user experience through interactive dashboards. Benefits include improved trust, scalability, compliance, and support for agentic AI and chatbots. (Source: https://www.falkordb.com/)
Use Cases & Benefits
Who can benefit from using FalkorDB?
FalkorDB is designed for developers, data scientists, engineers, and security analysts in enterprises, SaaS providers, and organizations managing complex, interconnected data in real-time or interactive environments. It is especially valuable for teams building AI-driven applications, cybersecurity solutions, and compliance workflows. (Source: https://www.falkordb.com/get-a-demo/)
What industries use FalkorDB?
Industries represented in FalkorDB case studies include healthcare (AdaptX), media and entertainment (XR.Voyage), and artificial intelligence/ethical AI development (Virtuous AI). (Source: https://www.falkordb.com/case-studies/)
What are some real-world use cases for FalkorDB?
FalkorDB is used for Text2SQL (natural language to SQL queries), security graph building (CNAPP, CSPM, CIEM), GraphRAG for advanced retrieval, agentic AI and chatbots, and real-time fraud detection. These use cases are supported by customer success stories in healthcare, media, and AI. (Source: https://www.falkordb.com/)
What business impact can customers expect from FalkorDB?
Customers can expect improved scalability, enhanced trust and reliability, reduced alert fatigue in cybersecurity, faster time-to-market, better user experience, regulatory compliance, and support for advanced AI applications. These outcomes are demonstrated in case studies with AdaptX, XR.Voyage, and Virtuous AI. (Source: https://www.falkordb.com/)
What pain points does FalkorDB address?
FalkorDB addresses pain points such as trust and reliability in LLM-based applications, scalability and data management, alert fatigue in cybersecurity, performance limitations of competitors, interactive data analysis, regulatory compliance, and support for agentic AI and chatbots. (Source: https://www.falkordb.com/)
Can you share customer success stories with FalkorDB?
Yes, AdaptX used FalkorDB to analyze clinical data, XR.Voyage overcame scalability challenges in immersive media, and Virtuous AI built a high-performance, multi-modal data store for ethical AI development. Read their stories on the case studies page.
What feedback have customers given about FalkorDB's ease of use?
Customers like AdaptX and 2Arrows have praised FalkorDB for its ease of use and performance. AdaptX highlighted rapid access to clinical insights, while 2Arrows described FalkorDB as a "game-changer" for non-traversal queries and high-speed analysis. (Source: https://www.falkordb.com/case-studies/)
Pricing & Plans
What pricing plans does FalkorDB offer?
FalkorDB offers four pricing plans: FREE (for MVPs with community support), STARTUP (from /1GB/month, includes TLS and automated backups), PRO (from 0/8GB/month, includes cluster deployment and high availability), and ENTERPRISE (custom pricing with VPC, custom backups, and 24/7 support). (Source: https://www.falkordb.com/)
What features are included in the FREE plan?
The FREE plan is designed for building a powerful MVP and includes community support. It is ideal for early-stage projects and experimentation. (Source: https://www.falkordb.com/)
What features are included in the STARTUP plan?
The STARTUP plan starts at /1GB/month and includes TLS encryption and automated backups, making it suitable for growing teams and production workloads. (Source: https://www.falkordb.com/)
What features are included in the PRO plan?
The PRO plan starts at 0/8GB/month and includes advanced features such as cluster deployment and high availability, ideal for mission-critical applications. (Source: https://www.falkordb.com/)
What features are included in the ENTERPRISE plan?
The ENTERPRISE plan offers tailored pricing and includes enterprise-grade features such as VPC deployment, custom backups, and 24/7 support, meeting the needs of large organizations with strict requirements. (Source: https://www.falkordb.com/)
Competition & Comparison
How does FalkorDB compare to Neo4j?
FalkorDB offers up to 496x faster latency, 6x better memory efficiency, flexible horizontal scaling, and built-in multi-tenancy in all plans, compared to Neo4j's on-disk storage, Java implementation, and premium-only multi-tenancy. For details, see the Neo4j comparison page.
How does FalkorDB compare to AWS Neptune?
FalkorDB is open source, supports multi-tenancy, offers better latency performance, and supports the Cypher query language, while AWS Neptune is proprietary, has limited vector search, and lacks multi-tenancy. For more, see the AWS Neptune comparison page.
How does FalkorDB compare to TigerGraph?
FalkorDB provides faster latency, more efficient memory usage, and flexible horizontal scaling compared to TigerGraph's moderate memory efficiency and limited scaling. (Source: https://www.falkordb.com/)
How does FalkorDB compare to ArangoDB?
FalkorDB demonstrates superior latency and memory efficiency, with flexible horizontal scaling, compared to ArangoDB's moderate memory efficiency and limited scaling. (Source: https://www.falkordb.com/)
Why choose FalkorDB over other graph databases?
FalkorDB stands out with exceptional performance (up to 496x faster latency), scalability, built-in multi-tenancy, advanced AI integration, open-source licensing, and enhanced user experience. It is trusted by customers in healthcare, media, and AI. (Source: https://www.falkordb.com/)
Security & Compliance
Is FalkorDB SOC 2 Type II compliant?
Yes, FalkorDB is SOC 2 Type II compliant, meeting rigorous standards for security, availability, processing integrity, confidentiality, and privacy. (Source: https://www.falkordb.com/get-a-demo/)
What security and compliance certifications does FalkorDB have?
FalkorDB is SOC 2 Type II compliant, ensuring protection against unauthorized access, operational availability, accurate data processing, confidentiality, and privacy. (Source: https://www.falkordb.com/get-a-demo/)
Support & Implementation
How long does it take to implement FalkorDB?
FalkorDB is built for rapid deployment, enabling teams to go from concept to enterprise-grade solutions in weeks, not months. (Source: https://www.falkordb.com/get-a-demo/)
How easy is it to get started with FalkorDB?
Getting started is straightforward: sign up for FalkorDB Cloud, try a free instance, run locally with Docker, schedule a demo, or access comprehensive documentation and community support via Discord and GitHub. (Source: https://www.falkordb.com/get-a-demo/)
What support options are available for FalkorDB users?
Support options include comprehensive documentation, community support via Discord and GitHub Discussions, access to solution architects, and demo/trial options for onboarding. (Source: https://www.falkordb.com/)