From documents to answers: a knowledge graph you can question
Upload your documents, watch a knowledge graph build itself in real time, and get answers you can actually verify. No code, no Cypher, no pipeline to assemble. It’s a free, hosted app.
GraphRAG by FalkorDBgraphrag.falkordb.com~8 min read
01
The retrieval problem nobody talks about
Most of what an organization knows doesn’t live in a database. It lives in PDFs, wikis, contracts, and support docs: a vast ocean of unstructured text that keyword search skims and classic vector RAG only partially understands.
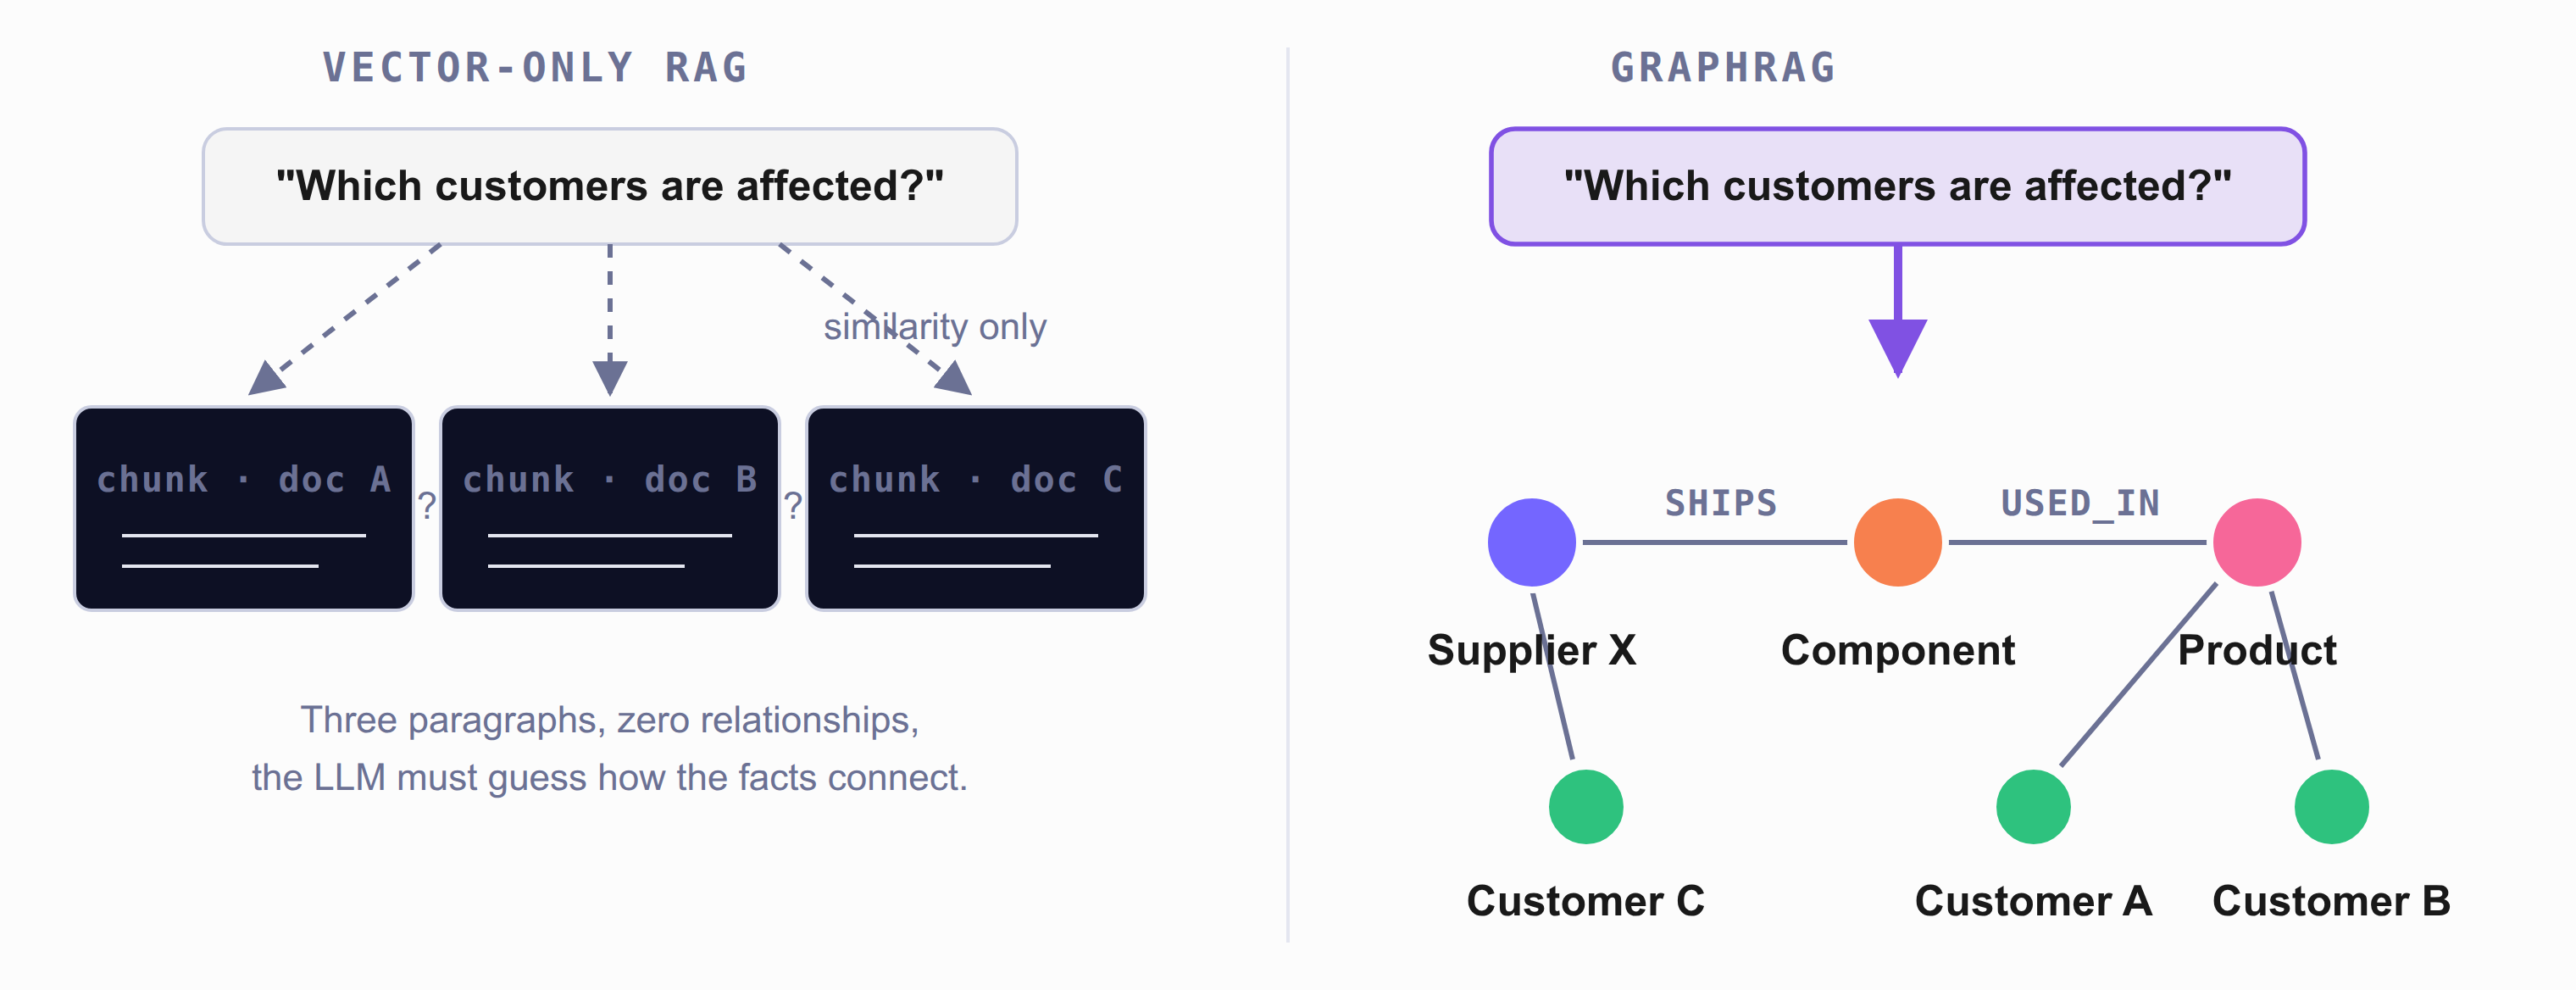
Vector-only RAG has a well-known blind spot. It retrieves chunks that sound like your question, but it has no idea how the facts inside those chunks relate to each other. Ask a question whose answer spans three documents (“which customers are affected by the component that supplier X ships?”) and similarity search will happily hand your LLM three disconnected paragraphs and hope for the best.
A knowledge graph doesn’t retrieve text that resembles the question. It walks the edges that answer it.
GraphRAG closes that gap. Instead of treating your documents as a bag of embeddings, it extracts the entities and relationships inside them into a knowledge graph, then answers by retrieving both the relevant text and the connected facts around it. The result: answers that are grounded, connected, and, crucially, explainable.
Fig. 01: Why relationships matter. Vector search returns look-alike chunks with no structure. GraphRAG retrieves the connected entities too.diagram
See it on a real question
We ran it. Here’s the receipt
One question, answered two ways over the identical 50-document graph: same embeddings, same model, only retrieval differs.
“In which cities have World Cup finals been played? List them all.”
◐ Vector RAG
Montevideo, Stockholm, Buenos Aires, Mexico City, Munich, Paris, Rome, Córdoba, Seville, Johannesburg, Rio de Janeiro, Santiago, Berlin, Belo Horizonte, Lusail.
Three of those never hosted a final, and it still misses seven that did, including Madrid, Pasadena, and Moscow.
● GraphRAG graph win · vector hallucinated
Montevideo (1930), Rome (1934, 1990), Paris (1938), Rio de Janeiro (1950, 2014), Bern (1954), Solna/Stockholm (1958), Santiago (1962), London (1966), Mexico City (1970, 1986), Munich (1974), Buenos Aires (1978), Madrid (1982), Pasadena (1994), Saint-Denis (1998), Yokohama (2002), Berlin (2006), Johannesburg (2010), Moscow (2018), Lusail (2022).
All 22 finals, none invented.
02
What you get in five minutes
GraphRAG by FalkorDB gives you this entire pipeline as a hosted web app. Sign in, drop in your documents, start asking questions. The flow is deliberately simple: Ingest → Ask → Explore.
1 Ingest documents
Head to Ingest and upload PDF, TXT, or Markdown files. As each file is processed, the app streams live progress through the extraction pipeline over server-sent events, so you can watch every step happen. No black box, no spinner-and-pray.
Fig. 02: Ingestion. Upload → chunk → extract → resolve, streamed live over SSE.
The document is loaded and split into chunks.
An LLM extracts the entities and relationships from each chunk.
Duplicate entities are resolved and merged (more on this below).
Chunks, entities, and facts are written to the graph and indexed for both vector and graph retrieval.
The stage most pipelines skip: entity resolution
Extraction is easy to demo and hard to trust. Run an LLM over ten documents and you’ll get “Lionel Messi”, “Messi”, and “L. Messi” as three different nodes, and your graph is now three disconnected islands wearing the same jersey. GraphRAG’s resolution pass merges those duplicates and rewires their edges onto a single survivor node, so the graph you query is clean, not a cloud of near-identical entities.
When ingestion finishes you get a summary of what was added: new entities, new relationships, indexed chunks. Ingest more documents into the same graph and the new knowledge connects to the old; entities mentioned across files link up, and the graph gets denser and more useful with every upload.
It meets you halfway: after ingestion the app auto-generates a short domain summary of what your graph now knows, plus starter questions to try, so you’re never staring at an empty chat box wondering what to ask.
2 Ask questions
Open Chat and ask in plain language. Behind the scenes the system rewrites follow-ups into self-contained queries, retrieves the relevant chunks and the connected entities from your graph, then answers grounded in that retrieved context, not in whatever the model half-remembers from pretraining.
Every answer ships with two things most RAG apps don’t give you:
Source context: the exact chunks and entities the answer was built from, so you can verify it against the original documents.
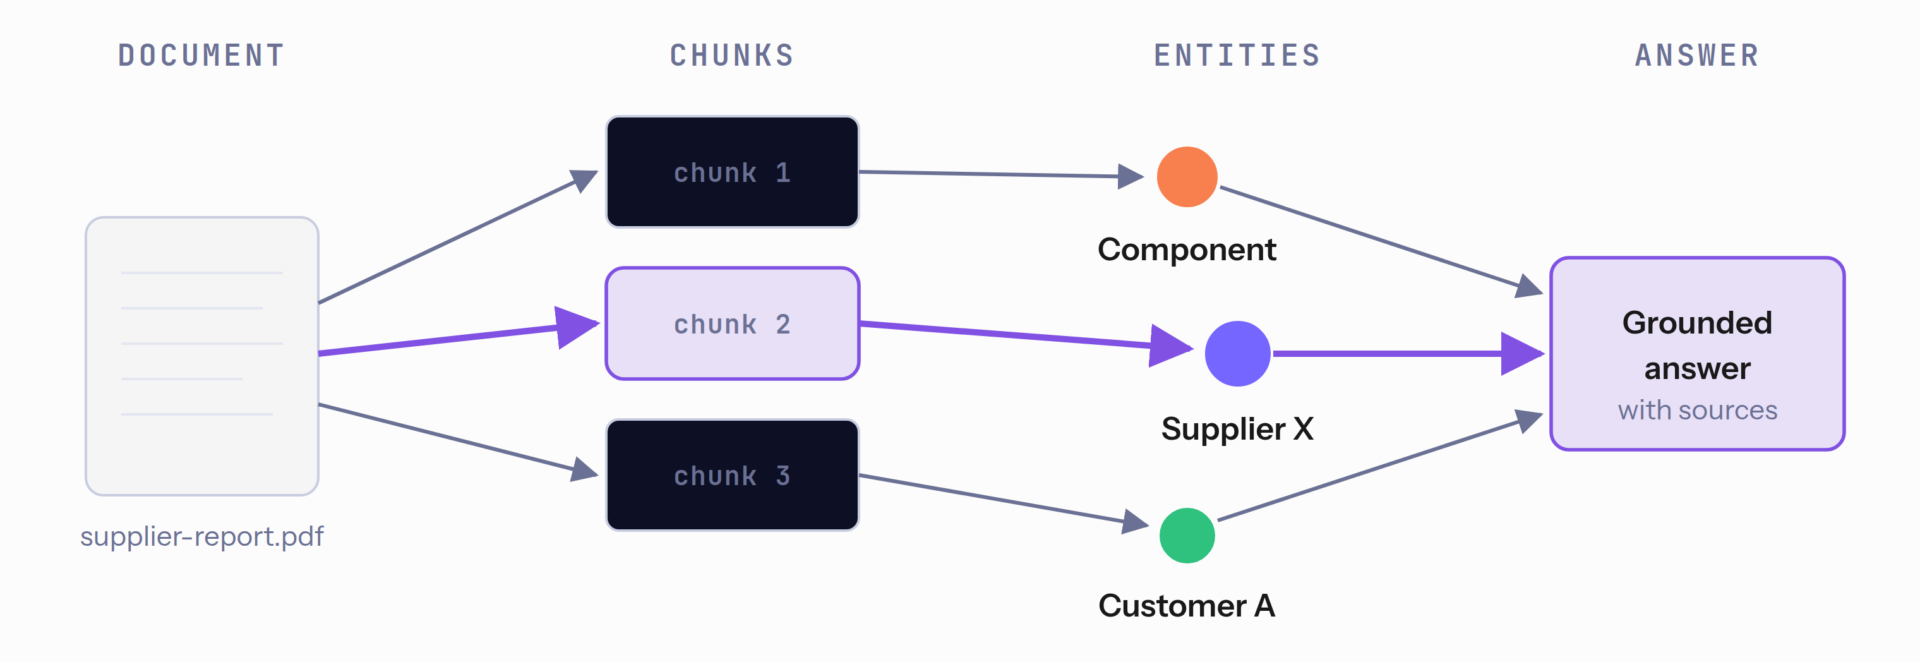
An explainability subgraph: a small, rendered graph showing the full provenance chain: source document → chunks → entities → answer.
The contract behind every answer is one sentence: answer only from the retrieved facts, and cite them as [N].
That contract is what turns “trust me” into “check me.” When an answer looks surprising, you don’t take it on faith or grep your documents by hand. You see the path the knowledge took. And if the graph doesn’t contain the answer, the assistant says so instead of improvising.
Fig. 04: Show your work. Every answer carries its provenance: which document, which chunks, which entities. The highlighted path is the lineage behind one claim.diagram
3 Explore the graph
Open Graph for an interactive, force-directed visualization of everything that was extracted. Nodes are colored by entity type; click any node to inspect its properties and connections.
This view is more than eye candy. It’s the fastest way to sanity-check what ingestion actually understood, and just as often to discover relationships you didn’t know were there. Two projects sharing a supplier, a person appearing in documents from different teams: the graph surfaces connections that no amount of scrolling through PDFs would.
03
Under the hood
The app is a full-stack, production-shaped system, a React management UI and an embeddable widget on top of a FastAPI service, all backed by a single FalkorDB instance:
Fig. 05: The stack. One engine for graph + vectors, a retrieval pipeline, an API, and a one-line embed.
A few design decisions worth calling out:
One database for graph and vectors. FalkorDB stores the knowledge graph and the vector embeddings in the same engine. There’s no separate vector database to deploy, sync, or pay for. Retrieval combines similarity search and graph traversal in one place. That’s a real operational difference from stacks that bolt a vector store onto a graph.
A dual-LLM pipeline. Ingestion and retrieval use independently configured providers. Extraction quality scales with model strength, while chat needs low latency, so a strong model can build the graph while a fast, cheap one answers questions. Routed through LiteLLM, the platform supports OpenAI, Azure OpenAI, Anthropic, and 100+ other providers. The embedder follows the ingestion side, so ingest-time and query-time vectors always share the same space.
Real multi-tenancy. With Google or GitHub sign-in, every user gets a dedicated, isolated graph (kg_{user_id}). Your documents and answers are never mixed with those of other users. You can create additional graphs, each isolated from the others, and graphs are lazily provisioned on first use so cold starts stay fast.
100+
LLM providers via LiteLLM (OpenAI, Azure, Anthropic…)
2
independent LLM lanes: ingestion vs retrieval
1
engine for graph + vectors (FalkorDB), nothing to sync
[N]
numbered citation under every grounded answer
04
Bonus: publish your graph as a chat widget
Here’s the feature that turns this from a tool into a product: any graph you build can be published as an embeddable chat widget on an external website, a standalone script you drop into any page. Ingest your product docs, sanity-check the graph, and ship a grounded, source-backed docs assistant on your own site.
Fig. 06: One tag to ship it. Paste a script tag; get a graph-grounded assistant with citations.
Grab the snippet from your dashboard and paste it into any page you own:
Shadow-DOM isolation: the widget mounts inside a shadow root, so your site’s CSS can’t break it and it can’t break your site.
Token hygiene: the graph token travels only in a request header, never in a query string where it would leak into logs and referrers.
Suggested questions on load, citations under every answer, and 👍/👎 feedback baked in, plus a support hand-off form for when the graph genuinely can’t help.
Origin allow-listing and per-IP rate limits on the public routes, and the retrieval side stays read-only. The widget can answer from your knowledge without ever being able to change it.
The quiet superpower: your docs site, an internal tool, and a public widget can all run off the same graph. Fix a wrong answer once (at the source node) and every surface gets it right. No re-embedding a corpus, no retraining, no chasing three separate bots.
05
The takeaway
RAG made LLMs useful on private data. GraphRAG makes them trustworthy on it, because retrieval that understands relationships produces answers that are connected, and provenance you can render as a graph produces answers you can verify.
GraphRAG by FalkorDB packages that whole idea (extraction, deduplication, hybrid retrieval, explainability, and even distribution via the widget) into something you can try before your coffee cools. No install, no Cypher, no graph expertise required to start.
Gal is a Software and AI Engineer, leading the development of GraphRAG-SDK, a specialized toolkit for building Graph Retrieval-Augmented Generation (GraphRAG) systems. It integrates knowledge graphs, ontology management, and state-of-the-art LLMs to deliver accurate, efficient, and customizable RAG workflows.