



Fraud is no longer a marginal checkout problem. As a baseline benchmark, the Cybersource Global Fraud Report 2024 found that global eCommerce merchants were losing 1.37% of total revenue to fraud in 2024, up from 1.13% in 2022, a 21% rise over two years, with an estimated $48 billion in annual losses and operational expense. What makes that number more damaging is the operational waste around it. Many institutions report false positive rates in the high 90s, so teams spend their day chasing transactions that should have sailed through.
That combination changes the architecture question. This isn’t about adding one more rule or one more model. It’s about building a system that understands relationships in real time, scores risk fast enough to sit in the authorization path, and gives analysts evidence instead of opaque alerts.
The design that works best is a graph-based fraud platform backed by event streaming, targeted machine learning, and explainable orchestration. The graph is the connective tissue. It links account, device, payment instrument, IP, merchant, session, and dispute activity into one traversable structure. Once that foundation exists, ring detection, account takeover detection, and investigation workflows stop being separate tools and become parts of the same system.
Table of Contents
- Why Traditional Fraud Detection Is Failing
- Modeling Data for Fraud Insights
- Uncovering Rings with Real-Time Graph Analytics
- Building Hybrid Intelligence with Graphs and ML
- Architecting a Scalable Detection System
- Integrating Fraud Signals into Your Workflow
- Measuring Success and Creating Actionable Playbooks
Why Traditional Fraud Detection Is Failing
According to the 2024 fraud data cited earlier in this article, fraud pressure is still rising while many payment teams are already running multiple controls. That gap points to an architectural problem, not just a tuning problem.
Legacy payment fraud prevention stacks were often assembled one layer at a time. A velocity rule was added after card testing. A geolocation rule followed an account takeover wave. A third-party device score came in after chargebacks increased. Each control addressed a real incident, but the stack usually ended up as a chain of point defenses with different latency, different identifiers, and different ideas of risk.
That design breaks down against coordinated fraud.
Fraud rings do not operate inside one table or one event stream. They spread activity across accounts, devices, IPs, sessions, and payment instruments, then keep each individual action just ordinary enough to avoid a single-event rule. A transaction scorer that only sees the current authorization request misses the relationship pattern. A tabular model trained on per-transaction features often misses it too, especially when the strongest signal is shared infrastructure across entities rather than an anomaly in one row.
Siloed tools create blind spots
The operational failure shows up before the model review does. Login telemetry lives in one system. Payment events live in another. Device reputation sits behind an API. CRM and dispute data arrive later, often after the authorization decision is gone. By the time an analyst tries to reconstruct what happened, the evidence is fragmented across systems that were never designed to answer connected questions in real time.
I treat that as a data architecture issue first. If the platform cannot resolve identity across sources and query connected behavior inside the decision window, the fraud team is forced into delayed investigation instead of prevention. That is why the architecture used for storing security data in a graph maps so well to payment fraud. Both problems depend on linking entities and events fast enough to make the connection useful.
A common anti-pattern is scoring first and investigating later. That keeps the online path simple, but it pushes the hard part into operations. Analysts then work across three dashboards, export CSVs, and try to confirm whether a device cluster, mule account set, or card testing pattern is real. At that point, the system has already missed the moment where context mattered most.
Practical rule: If your fraud team needs three dashboards and a spreadsheet to confirm a linked-entity pattern, your detection stack is too late and too fragmented.
False positives are the hidden tax
Fraud loss is visible on a finance report. False positives spread through the business more subtly.
They show up as abandoned checkouts, avoidable manual reviews, support contacts, and analysts who stop trusting the queue because too many alerts collapse under basic investigation. Teams usually respond in one of two ways. They loosen thresholds and accept more fraud, or they tighten rules and block more legitimate customers. Neither choice fixes the cause, which is missing context at decision time.
The trade-off is real. Richer context can increase decision latency, and that matters on an authorization path. But the answer is not to keep the model blind. The answer is to design a system that maintains connected state ahead of the transaction, so the decision engine can ask better questions without waiting on a long chain of joins and API calls.
Why the architecture has to change
Traditional stacks assume fraud is a property of an event. Modern payment fraud is often a property of a network.
That changes the blueprint. Detection has to combine event scoring with relationship analysis, shared-entity tracking, and evidence that operations can act on. A declined transaction should be explainable with facts such as repeated device reuse across unrelated accounts, recent linkage to known bad entities, or a sudden shift in the account’s normal neighborhood of activity. Without that, teams fall back to threshold tuning, case backlog grows, and each new fraud pattern triggers one more isolated control instead of a better system.
Modeling Data for Fraud Insights
Fraud detection gets better the moment the data model stops treating transactions as isolated rows. The job isn’t to collect more fields. The job is to represent how entities interact so the system can ask relational questions quickly.
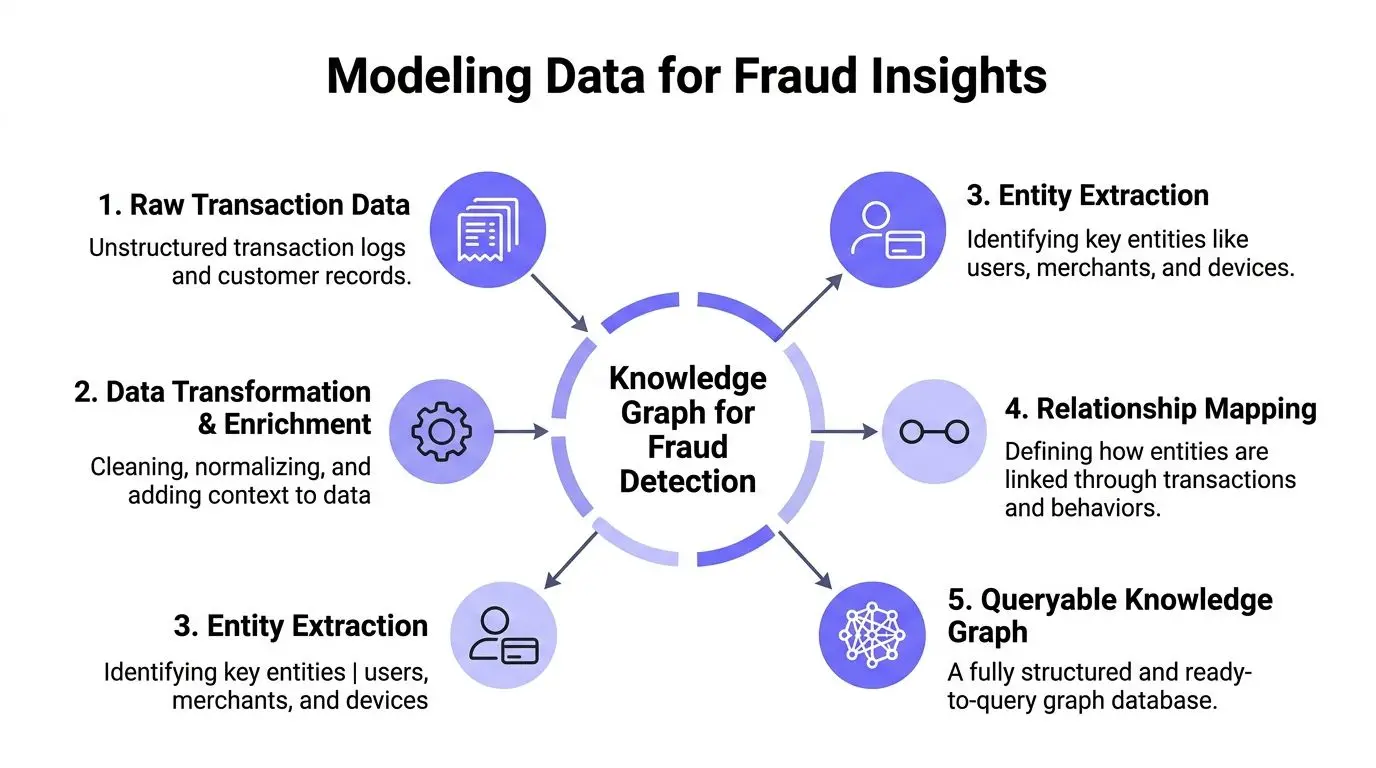
Caption: A fraud graph works best when stable entities and their relationships are modeled for fast, explainable queries.
A useful mental model comes from broader security graph design. This piece on storing security data in a graph maps closely to fraud because both domains depend on linking identities, assets, events, and behavior instead of flattening them into disconnected records.
Start with stable entities
I model fraud graphs around entities that remain meaningful across many events. Those become the nodes that anchor history and relationship analysis.
Core node types usually include:
- Account for the customer or business identity that logs in and transacts.
- Device for browser, mobile app, or hardware fingerprint.
- Payment instrument for card token, bank account token, or wallet identifier.
- IP or network identity for access origin.
- Merchant for destination and context.
- Session for short-lived behavior that ties authentication and checkout together.
- Transaction for the event being scored.
- Address for billing, shipping, or payout destination.
- Dispute or chargeback case for post-event feedback.
Not every node is equally durable. A session is transient. A device fingerprint may be sticky but imperfect. A payment token can rotate. That’s fine. The point is to preserve enough structure that the graph can compare present behavior to relationship history.
Treat relationships as first-class signals
Edges do more fraud work than many organizations anticipate. A transaction table can tell you that an account paid a merchant. A graph can also tell you that the same device logged into several accounts, that those accounts share a payment instrument, and that one of them already sits near a disputed cluster.
Useful edge types include:
| Relationship | Why it matters |
|---|---|
| USED_DEVICE | Exposes shared hardware across accounts |
| LOGGED_IN_FROM | Connects identity activity to network origin |
| INITIATED | Links account and session to transaction |
| PAID_WITH | Bridges transaction to instrument reuse |
| SHIPPED_TO | Reveals mule or reshipper concentration |
| CHARGEBACK_ON | Feeds confirmed outcomes back into the graph |
| SENT_PAYMENT_TO | Useful for tracing payout paths and beneficiary reuse |
I prefer explicit edges over overloaded event blobs. It costs more discipline up front, but it gives you clearer traversals later. If an analyst asks, “Show me all first-time buyers that share a device with disputed accounts and reused the same shipping destination,” the graph should answer directly.
A graph model should make suspicious linkage obvious. If you need a long ETL job to reconstruct basic entity relationships, the model is under-specified.
Build for query paths not just storage
The best fraud schemas are designed around the questions you need to answer in the authorization path and the case queue.
For example, a single checkout event can be expressed as:
- Account logged into Session
- Session originated from Device
- Session came from IP
- Session initiated Transaction
- Transaction paid with Payment Instrument
- Transaction went to Merchant
- Transaction shipped to Address
That structure gives you immediate paths for linked-account detection, card reuse analysis, geographic anomalies, and downstream dispute enrichment. It also keeps the model extensible. If your team later adds synthetic identity detection or business email compromise scenarios, you can attach new entities and edges without redesigning the whole platform.
The important design choice is this: don’t model only what happened. Model what can be connected. Payment fraud prevention succeeds when the graph captures enough context to support millisecond traversals and enough semantics to explain why a path is risky.
Uncovering Rings with Real-Time Graph Analytics
Fraud rings create correlation before they create obvious loss. That is why ring detection belongs in the authorization path, not only in post-incident investigation.
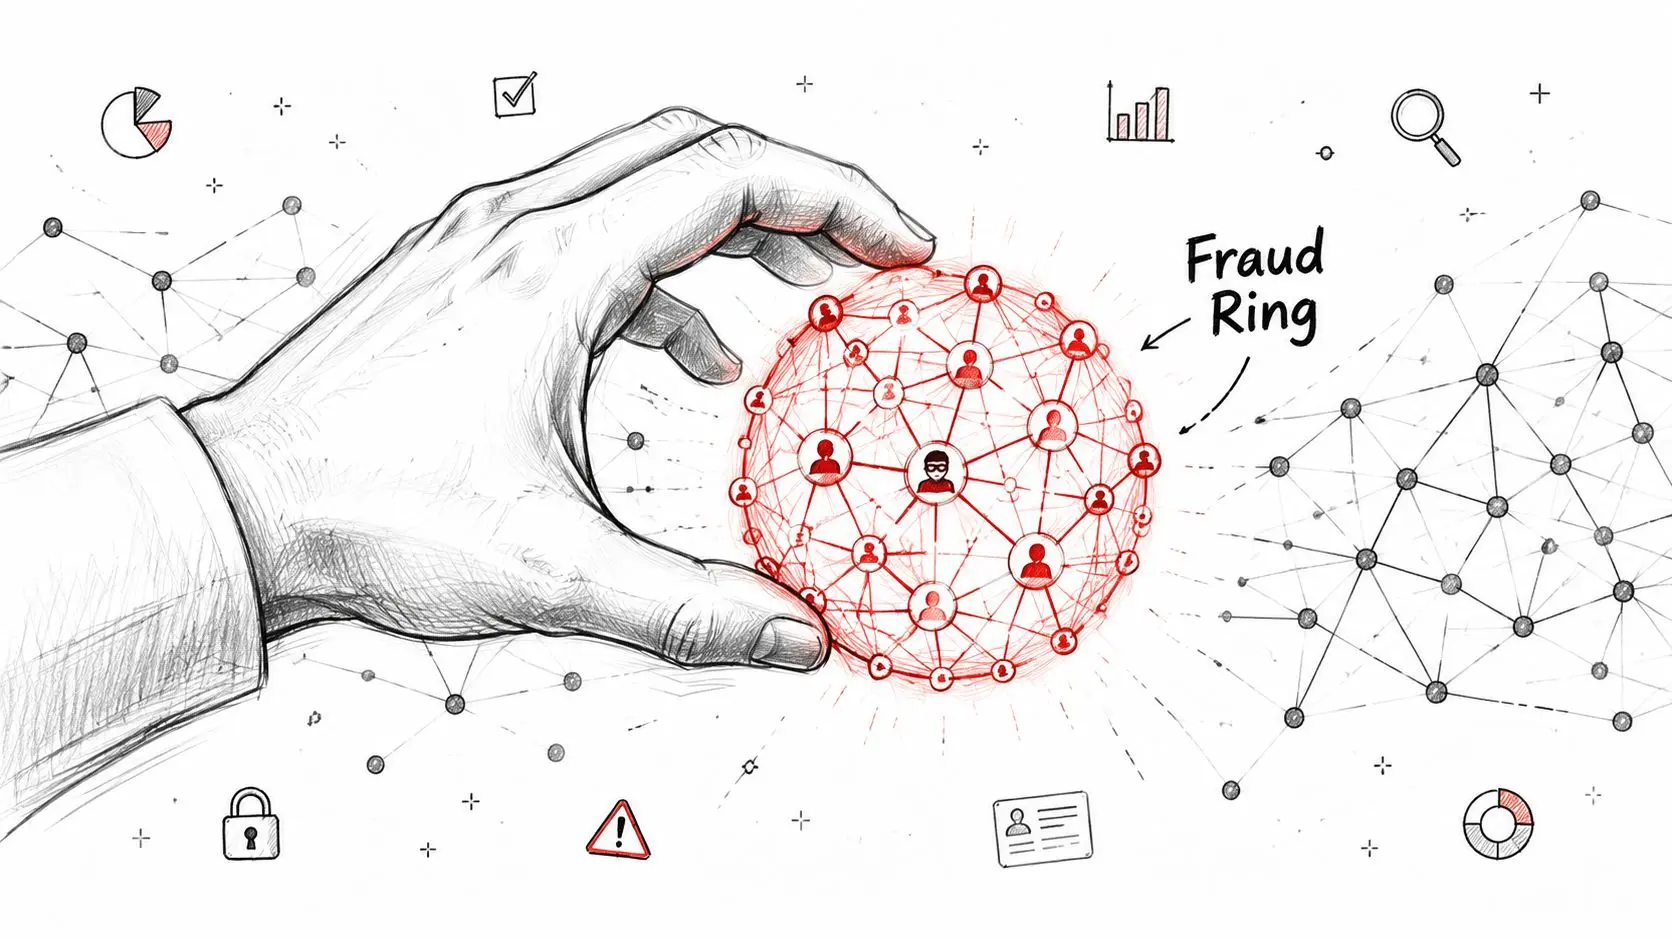
A ring rarely looks dangerous in one transaction
A coordinated ring usually starts with ordinary-looking events. New accounts appear within hours. Order amounts stay inside normal ranges. Billing details differ just enough to avoid simple reuse checks. A rules engine tuned for single-event anomalies often lets that traffic through because each authorization appears explainable on its own.
The pattern becomes visible once the system evaluates relationships at transaction time. Several accounts resolve to the same device fingerprint. A small IP pool rotates across those sessions. A subset of cards is reused across multiple identities. Shipments converge on a few addresses, freight forwarders, or slight address variants. Days later, one disputed order confirms what the graph had already shown. The account was never the primary unit of risk. The connected cluster was.
That distinction drives the architecture. Ring detection works when the graph can answer a narrow set of questions in milliseconds, under production latency limits, with enough context to support analyst review after the fact. A useful reference for these traversal patterns is this overview of finding connections with graph algorithms in complex networks. The same traversal logic maps well to payment fraud, but the production requirement is stricter. Queries have to be selective, bounded, and deployable in a live decision service.
The query patterns that matter
In production systems, I prioritize graph queries that expose coordinated behavior without forcing wide scans across the full network.
Three patterns consistently produce value:
-
Shared-entity fan-out
Start from the current device, card, IP, phone, or address. Count how many distinct accounts or orders appear within one or two hops, then constrain that count by a recent time window. A burst of new-account fan-out from one device is often a stronger signal than the current order amount. -
Proximity to confirmed bad outcomes
Measure whether the current transaction sits close to chargebacks, confirmed fraud cases, or blocked entities. Short paths matter most when they pass through nodes that are expensive for an attacker to replace, such as a device, payout destination, or long-lived browser identity. -
Temporal neighborhood change
Compare the current transaction’s local subgraph with the account’s prior neighborhood. One new attribute is common. Several simultaneous changes, such as a new device, new shipping cluster, and new payment instrument, usually justify a higher score because the attacker is rebuilding the identity surface all at once.
The best ring queries are operational, not ornamental. One high-yield pattern is to retrieve accounts created in the last few days that share a device and payment instrument, then rank the connected component by address reuse, dispute proximity, and creation velocity. That query is simple enough to run in real time and specific enough to avoid flooding analysts with loose associations.
Why graphs beat stitched investigations
Without a graph-backed workflow, ring analysis becomes a manual join problem. An analyst reviews the order, opens the device history, exports related accounts, checks IP reuse in another tool, reads dispute notes, and tries to reconstruct the cluster by hand. That process can support a single case review. It does not scale to authorization traffic or queue triage.
A graph-based payment fraud prevention system uses the same connected evidence twice. First, it enriches the immediate decision with ring features such as fan-out, component density, shared-entity counts, and hop distance to known bad nodes. Second, it gives investigators the exact subgraph that triggered the score, which reduces review time and makes model outcomes easier to defend.
In coordinated fraud, path structure often carries more signal than the transaction attributes alone.
That is the practical advantage of graph analytics in a modern fraud stack. They catch attacks that stay below per-event thresholds, and they reduce unnecessary declines by separating unusual behavior from behavior that is unusually connected.
Building Hybrid Intelligence with Graphs and ML
Graph analytics finds the relationships. Machine learning converts those relationships into a probability. Policy decides what the business will do with that probability. In a production payment fraud prevention system, those three parts have different jobs and different latency budgets, so I design them as separate services with a shared feature contract.
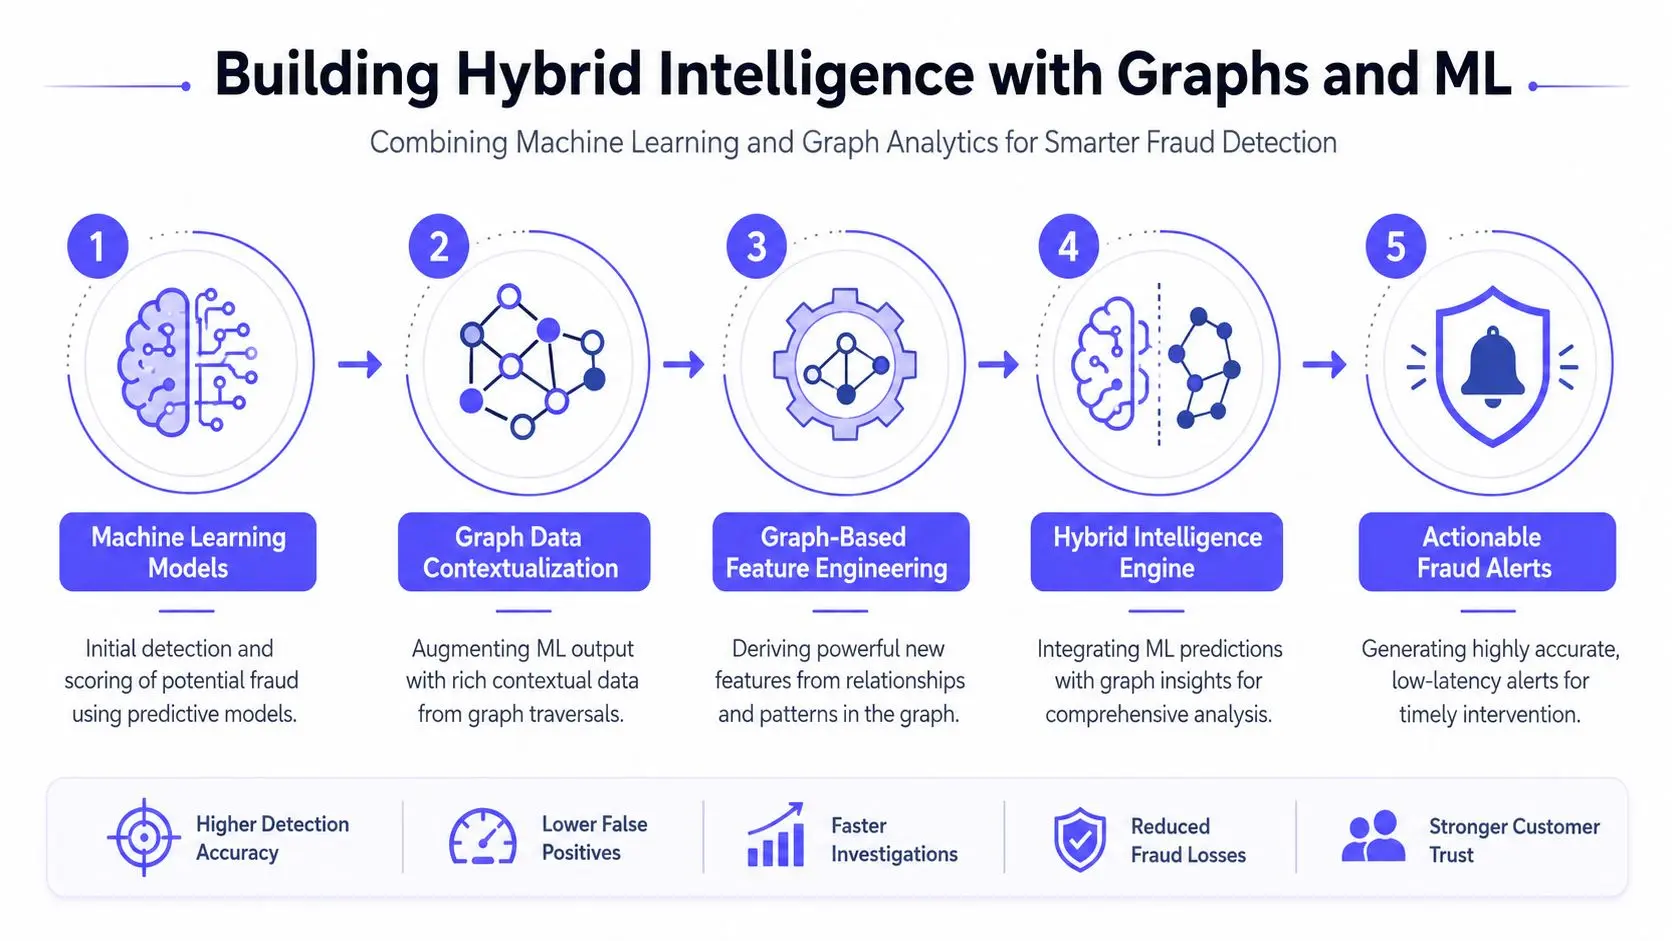
Caption: The strongest production systems combine graph signals, ML scoring, and policy actions in one decision flow.
Why a single model underperforms
A single fraud score usually collapses too many behaviors into one decision surface. That creates a predictable problem. Features that help catch account takeover are often weak for friendly fraud, and features that help catch card testing can distort risk for legitimate first-time buyers.
McKinsey notes in its piece on building a resilient payments system that resilient payment defenses use multiple controls aligned to specific threats. The same design principle applies to modeling. I use a model portfolio, not one artifact, because fraud is not one pattern.
A practical split looks like this:
- Account takeover model focused on login anomalies, device change, session behavior, and identity graph expansion
- Card testing model focused on authorization burst patterns, merchant velocity, issuer response codes, and shared payment credentials
- Synthetic identity or mule model focused on account creation chains, document reuse, address overlap, and graph proximity to known bad entities
- Friendly fraud model focused on fulfillment history, post-purchase behavior, prior disputes, and customer tenure
That architecture improves precision because each model sees a cleaner objective. It also improves operations. Teams can retrain or recalibrate one scorer without destabilizing the rest of the stack.
Turning graph structure into model-ready features
Graphs do not replace predictive models. They provide the structural evidence tabular features often miss.
The most useful graph features are usually simple enough to explain to an analyst and cheap enough to compute inside an authorization path. I prioritize features that answer specific fraud questions: Is this entity unusually connected? Is it close to confirmed abuse? Did this transaction create a suspicious number of new edges at once? Those questions translate well into production features.
Examples I use often include:
- Recent linked-account count per device or payment instrument
- Neighbor dispute rate around the customer, card, device, email, or address
- Minimum hop distance to a confirmed bad node
- New-edge count created by the current event across account, device, card, IP, and shipping relationships
- Connected-component growth rate over a short time window
- Shared-entity overlap score between the current account and previously reviewed fraud clusters
The point is not feature volume. The point is feature meaning. A graph feature should capture a fraud mechanic that operations teams recognize and investigators can verify.
This is also where storage design matters. Feature generation gets harder if graph traversals, transactional writes, and historical analysis all live in disconnected systems with different entity keys. A hybrid database architecture for OLTP, OLAP, and graph workloads reduces that integration tax and keeps feature definitions consistent from online scoring to offline training.
Hybrid scoring in production
The scoring path I trust has five layers, each with a narrow role and a clear interface:
| Layer | Role |
|---|---|
| Graph traversal service | Resolves entities, neighborhoods, and path-based signals for the event under review |
| Feature service | Materializes event, history, and graph features with stable versioning |
| Vector-specific ML models | Score distinct fraud modes such as account takeover, card testing, and friendly fraud |
| Decision engine | Applies thresholds, policy constraints, customer segment logic, and required actions |
| Feedback pipeline | Writes analyst decisions, chargebacks, and dispute outcomes back into training and monitoring datasets |
I keep the graph traversal service separate from the model service for a reason. Traversal logic changes with fraud patterns and investigator feedback. Model services need stricter release control, tighter performance monitoring, and reproducible feature schemas. Splitting them lets the fraud team update ring logic quickly without forcing a full model redeploy.
The decision engine should also consume more than scores. A transaction with a moderate model score but a short path to a confirmed bad device cluster may deserve step-up authentication. A higher score on a long-tenure customer with stable historical behavior may deserve review instead of decline. Hybrid intelligence works because the final action reflects both statistical risk and business context.
What to avoid
Two implementation mistakes show up often.
The first is feeding every available graph metric into the model and hoping feature importance will sort it out. That usually produces unstable training sets, slower inference, and weaker explanations. Start with a compact set of graph features tied to known attack behavior. Expand only when offline tests show distinct lift and online review teams confirm the signal is actionable.
The second is treating retraining as the whole feedback loop. Retraining matters, but fraud systems improve faster when feedback updates three things at once: labels, graph state, and policy thresholds. A newly confirmed mule account should influence neighborhood risk immediately, not only after the next training cycle.
Design note: Good fraud models do not replace traversals. They turn graph evidence into a repeatable scoring system that can run at production volume.
The end goal is a single decision platform. Graph services expose structure. ML services estimate risk by fraud type. Policy services translate that output into approve, challenge, review, or block. That end-to-end design is what turns isolated models into a real-time fraud prevention system.
Architecting a Scalable Detection System
Fraud losses are measured in the hundreds of billions globally, but the architectural problem inside a payment stack is more immediate. You usually have only a small slice of the authorization window to collect context, score risk, and return a decision without harming conversion. That constraint should shape the system from the first design review.
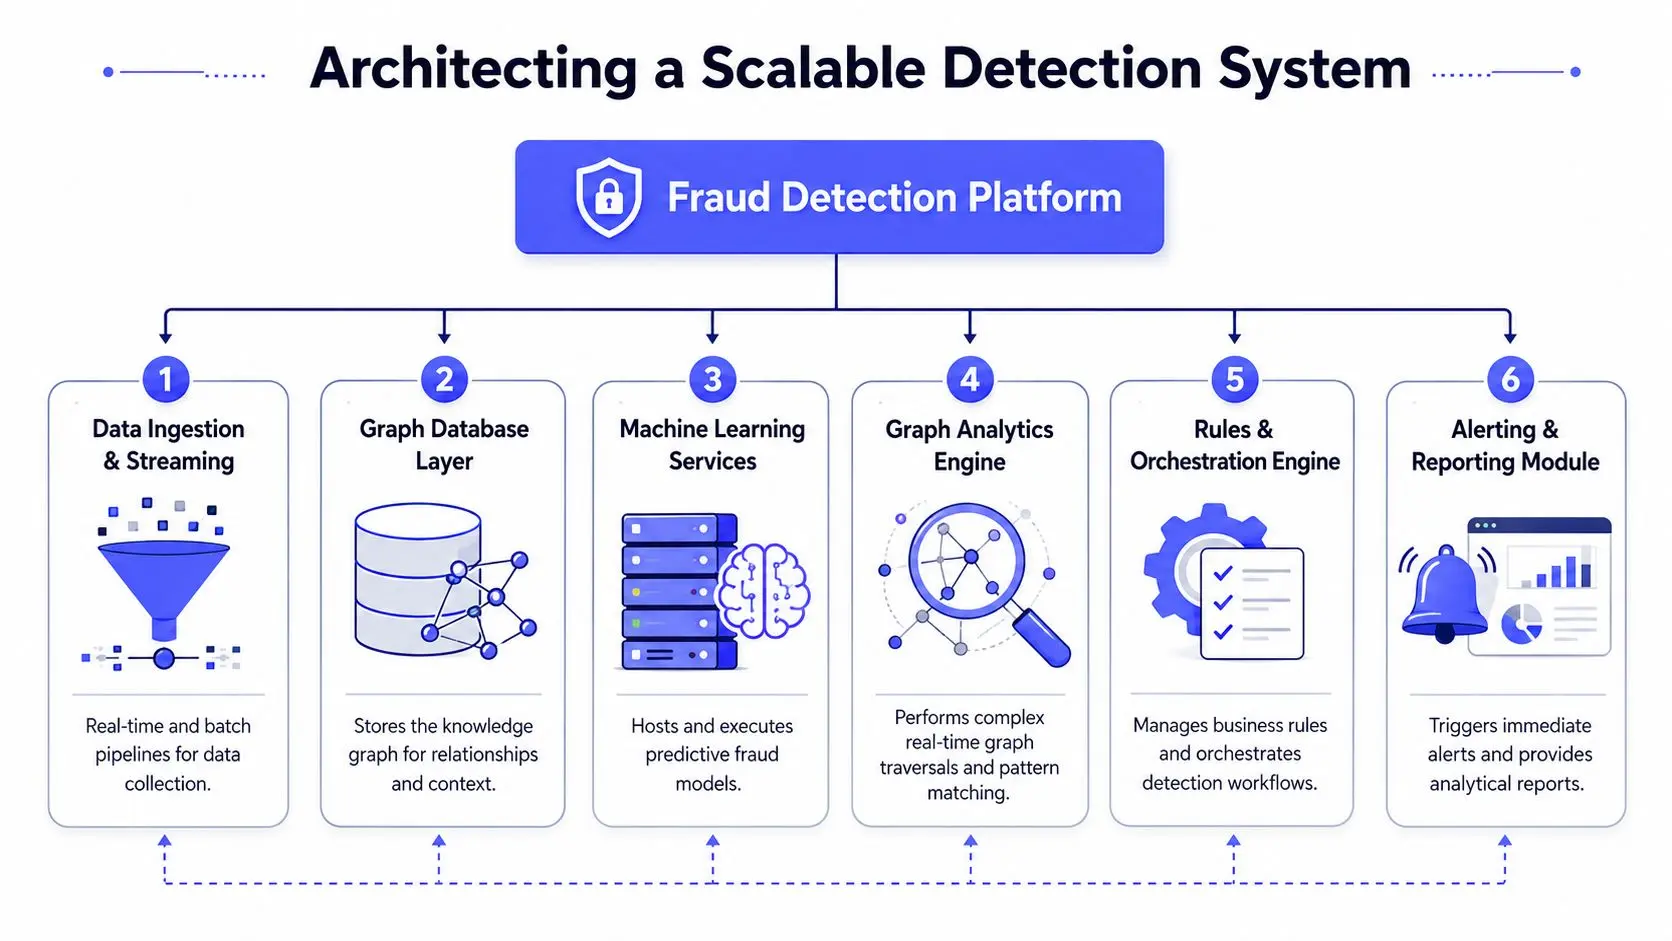
Caption: A scalable fraud stack separates the low-latency decision path from offline training, replay, and investigation work.
The low-latency path
I design the decision path to do one job well: take a payment event, pull the smallest set of high-value signals, and return a deterministic action fast enough for checkout.
A practical request path looks like this:
- The gateway or checkout service emits the authorization event.
- A stream processor validates the schema and attaches core identifiers such as account, device, card fingerprint, IP, and merchant.
- The graph service resolves connected entities and computes the local risk context from hot state.
- The feature service assembles the transaction, graph, and behavioral features needed for the active model version.
- The scoring service returns risk by fraud pattern, and the policy service maps that output to approve, challenge, review, or block.
- The decision API responds, and the full event continues through asynchronous enrichment and logging.
Short paths win here. Every network hop, storage lookup, and feature join increases tail latency and failure risk. That is why I keep the online path separate from warehouse queries, batch feature generation, and heavyweight investigations. The scoring path should read from systems built for current state, not reconstruct context from historical tables under live traffic.
The storage choice matters because fraud platforms need transactional updates, low-latency traversals, and analytical feedback loops in the same estate. Teams comparing data patterns should review hybrid database architecture for OLTP, OLAP, and graph workloads, since a single storage model rarely serves all three well.
Platform choices that hold up under load
Throughput alone is not a useful scaling target. The harder requirement is predictable performance during traffic spikes, issuer retries, promotion days, and attack bursts that create abnormal fan-out in the graph.
These design choices usually pay for themselves:
- Memory-optimized graph reads for the hot path. Authorization-time traversals should hit hot adjacency and recent risk state, not scan disk-backed relationship chains.
- Stateless scoring and policy services. This makes horizontal scaling straightforward and keeps deployments low risk during busy periods.
- Write-optimized ingestion separate from read-optimized decisioning. Graph upserts, replay handling, and event deduplication have different performance profiles than synchronous scoring.
- Bounded traversals and precomputed neighborhood features. Unlimited hops look attractive in a prototype and collapse under production cardinality.
- Tenant isolation at the data and policy layers. Multi-tenant fraud platforms need shared infrastructure with strict partitioning, not a separate stack for every merchant.
There is a trade-off in every one of these decisions. Precomputing graph features reduces online work but increases pipeline complexity. Tight traversal limits protect latency but can miss weak links that only appear in wider neighborhoods. Shared infrastructure lowers cost, but only if partitioning, quota controls, and noisy-neighbor protections are designed early instead of added after the first large merchant onboard.
A practical deployment pattern
I split the platform into an online plane and an offline plane because the workloads are different enough to deserve different operating rules.
The online plane serves the payment flow. It handles event intake, entity resolution, graph upserts for fresh relationships, low-latency reads, model inference, policy evaluation, and decision logging. Every dependency in this plane should have a clear latency budget and a fallback mode.
The offline plane handles the work that improves the system without blocking checkout. That includes replay, label reconciliation from disputes and chargebacks, feature backfills, analyst feedback ingestion, rule simulation, graph integrity checks, and model training. It also supports broader pattern discovery, where analysts and data scientists can examine new rings without risking production latency.
A simple ownership split keeps the boundary clear:
| Component | Online or offline | Notes |
|---|---|---|
| Event stream | Online | Carries authorization and account events with replay support |
| Graph writes | Online | Upserts entities and edges quickly, then confirms downstream |
| Feature backfills | Offline | Rebuilds historical features for training and audits |
| ML retraining | Offline | Uses confirmed outcomes and reviewed cases |
| Rule simulation | Offline | Tests threshold changes before release |
| Case tooling | Both | Reads live context online and stores analyst outcomes offline |
Failure handling deserves the same attention as model quality. If device intelligence is delayed, the system should continue with graph, account, and payment signals that are still within SLA. If the graph service is degraded, policy can fall back to a narrower ruleset with tighter limits on approvals from thin-file accounts. Good fraud architecture degrades by confidence tier, not by outage.
Integrating Fraud Signals into Your Workflow
Detection only matters if the signals reach the systems where people and automation can act on them. Many teams build a solid scoring engine and then undermine it with weak integrations. Scores end up in logs, alerts arrive without context, and analysts still work from screenshots and exported CSVs.
Connect upstream events cleanly
The upstream side should accept more than payment authorizations. A modern payment fraud prevention engine needs login events, device telemetry, account changes, password resets, checkout attempts, disputes, refunds, and chargeback outcomes. The cleaner the event contracts are, the less time the fraud team spends untangling schema drift.
The practical blueprint looks like this:
- Use a streaming backbone such as Kafka for low-latency event delivery from checkout, identity, and post-purchase systems.
- Normalize entity identifiers early so the graph layer isn’t forced to resolve basic naming inconsistencies under load.
- Separate event ingestion from scoring APIs because replay, retries, and backfills belong in the event path, not in the synchronous decision path.
- Version event schemas deliberately to avoid breaking model features and graph upserts.
A lot of false signal comes from upstream inconsistency, not fraud novelty. If one service sends a stable device token and another rotates identifiers unnecessarily, graph quality drops before analytics ever starts.
Turn scores into operational decisions
The downstream side should expose a decision API that returns more than a numeric score. It should return the action, the top evidence, and the next workflow destination.
Typical outputs include:
| Output | Use |
|---|---|
| Approve | Low-risk transaction proceeds |
| Challenge | Trigger MFA, step-up authentication, or issuer verification |
| Manual review | Create a case with graph evidence attached |
| Block | Hard stop based on high-confidence fraud signals |
| Monitor | Let the transaction proceed but increase post-event scrutiny |
I prefer routing high-risk or ambiguous cases into systems the operations team already watches, such as PagerDuty, Slack, or an internal queueing service. But the alert should include graph context, not just “risk score exceeded threshold.” An analyst needs to know whether the trigger came from shared-device fan-out, account takeover patterns, or risky neighborhood proximity.
A fraud alert without relationship evidence is just another interruption.
Give analysts graph context not raw alerts
Case management should pull a focused subgraph, not a dump of every connected entity. The analyst needs the shortest explanation path first.
A good case payload includes:
- The triggering transaction and account
- The entities most responsible for escalation
- A compact neighborhood view such as linked accounts, devices, payment instruments, and addresses
- Relevant prior outcomes including disputes or confirmed fraud labels
- Recommended next queries for deeper validation
That last point matters. Analysts work faster when the platform suggests follow-up paths. For a suspected ring, show linked-account expansion and shared destination analysis. For account takeover, show first-seen device, session change history, and payment instrument novelty. This makes the platform useful for action, not just detection.
Measuring Success and Creating Actionable Playbooks
Fraud losses are visible on a dashboard. The harder cost to see is decision quality. A payment fraud prevention system succeeds only if it reduces bad approvals, keeps good customers moving, and gives analysts enough context to act quickly.
I measure that at three layers because each layer exposes a different failure mode in the architecture.
The first layer is detection quality. Precision, recall, and false positive rate show whether the scoring stack is separating risky transactions from legitimate ones. The second is decision performance. Approval quality, challenge success rate, review backlog, and decision latency show whether orchestration is translating graph signals and model output into the right action inside the payment flow. The third is business impact. Fraud loss trend, recovered funds, customer friction, and analyst cost show whether the platform is improving margin rather than just producing more alerts.
A scorecard should stay short enough to review weekly and specific enough to diagnose where the system is failing.
| Metric family | What it answers |
|---|---|
| Precision and recall | Are we identifying the right transactions |
| False positive rate | How much legitimate payment volume are we disrupting |
| Decision latency | Can the platform score and route inside the authorization window |
| Queue health | Can analysts absorb escalations without creating delays |
| Outcome feedback coverage | Are disputes, chargebacks, and analyst decisions flowing back into labels |
Latency belongs on this list for a reason. In a graph-based architecture, traversal depth, feature generation, and model inference all compete for milliseconds. If a rule is accurate but pushes decision time beyond the payment gateway’s tolerance, it is poorly designed for production.
Turn alerts into operational playbooks
Analysts should not decide from scratch each time a case appears. The platform should package the evidence and attach a response pattern that matches the risk type.
For a suspected fraud ring:
- Pull the triggering transaction with its one-hop neighborhood first. Include devices, IPs, cards, emails, addresses, and merchant-side identifiers.
- Expand only the nodes that explain shared infrastructure across multiple recent accounts.
- Check whether the cluster contains prior chargebacks, confirmed fraud labels, or blocked entities.
- Suppress duplicate cases so one ring does not generate twenty analyst tickets.
- Block, hold, or review the connected accounts based on confidence and exposure, then preserve the subgraph used in the decision.
For a suspected account takeover:
- Confirm whether the session came from a first-seen device, unfamiliar ASN, or unusual login path.
- Compare the current transaction to the account’s normal graph neighborhood rather than to portfolio-wide averages alone.
- Review changes to recovery details, shipping address, payout destination, and stored payment instruments.
- Trigger step-up authentication, velocity controls, or temporary restriction of high-risk actions when the relationship pattern breaks from the account baseline.
Measure playbook quality, not just model quality
A mature team also measures whether playbooks produce consistent outcomes. I want to know how often ring alerts lead to confirmed fraud, how long account takeover cases remain in queue, which escalation paths create avoidable friction, and where analysts override the model because the evidence package is weak.
Those override patterns are useful architecture feedback. If analysts repeatedly ask for more device history, the case payload is too thin. If they ignore a graph expansion view because it is noisy, the entity resolution logic is over-connecting unrelated users. If review queues spike after a rule change, the orchestration layer is sending too many borderline cases to humans instead of separating them with better graph features upstream.
Keep feedback loops healthy
Fraud systems decay when feedback arrives late or arrives incomplete. Retraining schedules, rule reviews, and graph quality checks need to run as an operating routine, not as occasional cleanup.
I usually review four things together. Label freshness, so chargebacks and analyst outcomes are still usable for supervised learning. Entity resolution quality, so shared-device and shared-identity edges remain trustworthy. Feature stability, so graph-derived inputs do not drift undetected after a product or traffic change. Deployment performance, so new models improve decisions without adding unacceptable latency or queue volume.
An end-to-end platform is critical. A graph store, feature pipeline, rules engine, model service, case management layer, and feedback pipeline have to behave like one system. If any part of that loop breaks, the team keeps scoring transactions but loses the ability to learn from outcomes and improve the next decision.